Here’s When to Worry About Your Form Conversion Rates

You will probably never have a 100% conversion rate for your forms. That’s okay.
There are a surprisingly large number of things that can impact whether or not someone successfully completes one of your forms.
Opt-in forms, for example, can be negatively impacted by things like form placement on a landing page or a poorly-written headline.
In the case of ecommerce forms, something you can’t control like shipping prices might prevent users from completing the purchase process. Even button color or using the wrong font can hurt your conversions.
You’ll never win them all. But you should be winning some, right?
At what point do you start to ask, “Is this a good enough conversion rate or should I fix my form?”
How to Determine the Optimal Conversion Rate
Conversion rates vary by form type, landing page design, industry and user intent, so a “good” or “bad” conversion rate isn’t universally measurable.
But you can determine whether or not a conversion rate is optimal for you by using a conversion rate formula and comparing your results against your goals.
The basic conversion rate formula looks like this:
Number of actions taken / number of units = conversion rate
If you have 100 people (units) visit your landing page, but only 10 form submissions (actions taken), you would have a 10% conversion rate (10/100 = 0.10 or 10%).
A 10% rate might sound great, but it also depends on what you were expecting. If you expected 50 people to fill out a form (50% conversions),10% will feel disappointing.
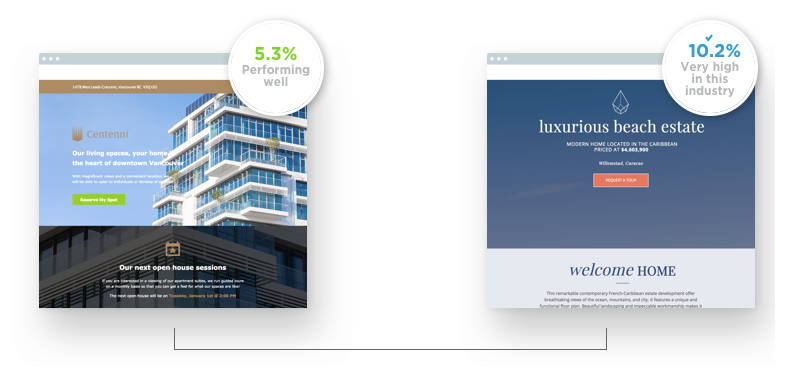
You might also be disappointed (or suprised) if you compare your conversion rates against industry benchmarks.
The median conversion rate is somewhere between 3-5% for most industries, but a higher or lower number than that can still be good or bad depending on the context and your desired outcome.
A 5% conversion rate when you have 100 visitors is vastly different than a 5% conversion rate when you 1,000 or even 10,000 visitors, for example.
Ultimately, it’s about measuring your data in a way that gives you the answer to the question, “Did we meet our goals?”.
If your goals are met, the actual percentage won’t matter as much.
Tracking Your Data to Set Realistic Goals
The real question isn’t “what’s a good conversion rate?” It’s “what’s realistic?”
To answer that, you need to understand what type of conversion you’re actually measuring and whether or not it has ROI for your business.
One experiment from ThinkTraffic compared conversion rates based on traffic sources.
When they measured 12 different sources to see which one gave them the highest conversion rates, they found that traffic numbers had little correlation.
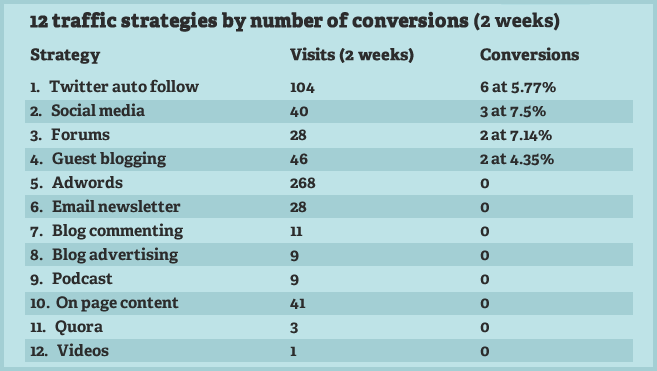
Their highest traffic pages didn’t have the highest conversion rates.
If their goal had simply been to increase traffic on their website, or they weren’t tracking their conversion rates by traffic sources, they might have assumed that their conversions were ok.
But looking at this data, it’s clear to see that certain strategies are working better than others. The same is true for form conversions.
In order to determine the true value of your conversion rates, you need conversion data.
One way to get this is to set up goals in Google Analytics. Without setting up goals, your Google Analytics results won’t be accurate.
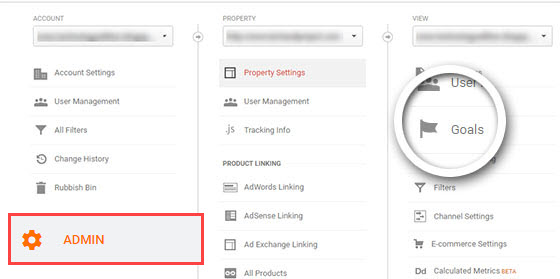
When correctly set up, you can use goal tracking reports to see which channels and user types (demographics) have the highest conversion rates.
This will give you the foundational insights into what you should expect. If your goal is 100 form submissions, but your data shows that you’re consistently getting 50 submissions, it might change your approach to conversion optimization.
You might look into why you’re capping off at 50, or you might change your mind about the importance of 50 form submissions for your bottom line.
That’s why in addition to tracking analytics goals, you also want to track your sales goals, too.
Every conversion has monetary value.
If you have a goal of tracking ecommerce transactions for a checkout form, for example, you can specify a goal value that translates into direct sales for your business.
This might give you a better sense of the true value of a conversion. It might make that “measly” 3% conversion rate feel better by comparison if you know that each conversion is worth $10,000.
On the other hand, it might make you say, “At $10,000 a conversion, we need to increase this rate!”
But if you’re not taking the time to compare your conversion rates against your goals, you’ll never know.
When to Start A/B Testing Your Forms
Your data can tell you that something’s wrong with your conversions, but it won’t tell you exactly what or why. You will have to dig a little deeper.
If you feel like your conversion rates aren’t living up to expectations, you want to start testing you forms to see which elements might be having a negative impact.
As mentioned, there are plenty of things that can cause your conversion rates to be low. You will most likely want to start with the “classic” factors when A/B testing first.
Test:
- The placement of your form on a landing page
- The placement of your form CTA
- The color of your form CTA
- Colors of surrounding images or the page branding
- Words in your headlines
- Words in your surrounding copy
- Adding copy or removing copy
- Using bullet points vs. not using bullet points
- Form alignment
- Number of form fields and form length
- Form labels and text placement
- Adding or removing trust signals
- Form type (full screen, pop-up, etc.)
You can use A/B testing WordPress plugins to handle some of these, those others might require more advanced A/B testing, like heat maps or customer surveys.
If you don’t want to pay for an extra testing tool or you simply don’t have the time to test every new form you build (testing does take time), you can use Google Analytics to redirect browsers to a new page that contains the a new form you’re testing.
By redirecting, you can test two forms against each other in a shorter amount of time.
Your results might not be perfect, but it should give you an idea of whether or not you want to pursue changing the form design for a chance at higher conversions.
Keep in mind that even small changes to seemingly minor elements of your form can have a big impact on conversion rates. So even if you dread the idea of A/B testing your forms, it might be worthwhile in the long run.
If, at the end of testing, you’re still not seeing the results you want, look back at your industry benchmarks to determine if this is just a normal conversion rate cap.
For some form types, you just won’t see a higher rate no matter what you do, and that’s ok.
Final Thoughts
Even though there’s no universally accepted “best” conversion rate, there is a best for your specific forms.
To measure it, use a standard conversion rate formula to calculate your rates accurately as possible, and then consider your goals as well as any context that might impact that rate.
If something still seems off, start A/B testing your forms and look for noticeable patterns.
If you find that changing the location of the CTA increased your conversion rates, then you know it’s realistic to expect a higher conversion rate.
On the other hand, if nothing really significantly changes, then it might be worth accepting the status quo.